


ArmInfo. Mineral raw materials account for the lion's share of Armenia's exports, accounting for 28%, while machinery and equipment are the dominant import item, accounting for 27%. The former has seen a sharp acceleration in growth, reaching significant rates, while the latter has moved from stagnation to high double-digit growth. This is evidenced by data from the RA Statistics Committee for January-August 2026.
Machinery and equipment, prepared foodstuffs, and precious metals/stones occupy the second, third, and fourth positions in exports, while land/air/water transport, mineral raw materials, and prepared foodstuffs occupy the second, third, and fourth positions in imports. Fifth place in exports went to base metals and stones, while fifth place went to chemical products in imports.
In total, the top five items account for 82% of exports ($3.8 billion) and 64% of imports ($5.5 billion). Moreover, precious metals and stones continue to decline significantly in both exports and imports, having lost their leading position in imports last year to machinery and equipment, subsequently dropping out of the top five, and now yielding their lead in exports to mineral raw materials, barely holding on to the top five. It is noteworthy that base metals/stones, among the top five export items, increased their annual dynamics from a 12.5% decline to a 9.3% growth, while land/air/water transport vehicles and chemical products, which occupied the 2nd and 5th positions in imports, significantly accelerated their annual growth - the former with a double-digit acceleration from 19.3% to 44.7% and the latter from a moderate 2.8% to a high double-digit 30.3%.
Thus, during the reporting period, mineral raw materials worth more than $1.3 billion were exported, machinery and mechanisms - $809.9 million (17.5% of the total), finished food products - $766 million (16.6%), precious metals/stones - $726.1 million (15.7%), and base metals/stones - Imports of machinery and equipment totaled over $2.3 billion, land/air/water transport totaled $989.4 million (11.4% of the total), mineral raw materials totaled $965.7 million (11.2%), finished food products totaled $668.4 million (7.7%), and chemical products totaled $572.9 million (6.6%). Let's look at the annual dynamics of these goods' exports and imports. Specifically, mineral raw material exports accelerated significantly, reaching a significant 77.8%, while import growth accelerated to 30.3%. Finished food products continued to accelerate, growing at a 25.6% rate, while exports reversed their double-digit growth to a 0.5% decline. Machinery and equipment recovered from stagnation in imports by 38.7%, while exports reversed their decline to a meager 0.1% growth, while precious metals and stones declined significantly in both exports and imports, ranging from 53.4% to 66%. Imports of land/air/water transport increased by 44.7% year-on-year, accelerating, while their significantly smaller exports recovered from a significant decline to double-digit growth of 48.4%. Base metals and stones in exports recovered from a double-digit decline to 9.3% growth, while import growth slowed significantly to 3.1%. Chemical industry imports accelerated to a double-digit 30.3%, while exports slowed to 6.5%.
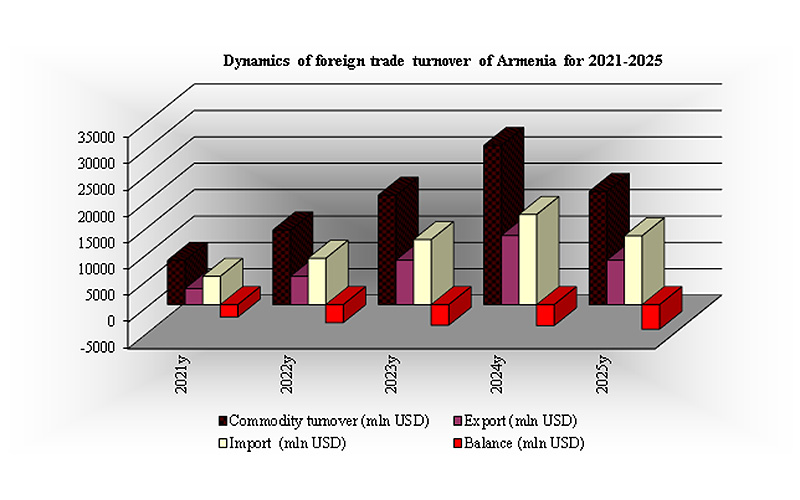
According to statistics, total exports in January-August 2026 exceeded $4.6 billion, while imports reached $8.7 billion. Exports remained in decline, but with an annual rate slowing from 48.8% to 6.5%, while imports recovered from a 34.9% decline to a 9.3% increase.
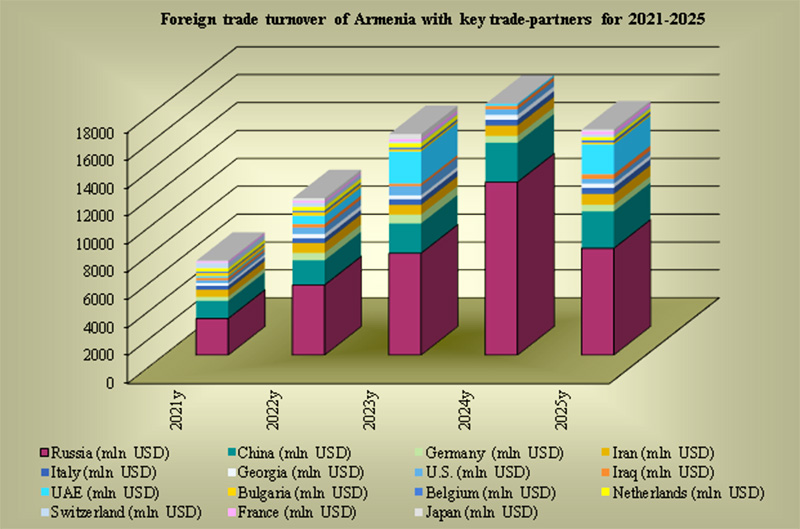
By country, exports and imports to the EAEU decreased by 8.5-23.4% (due to a decline of 9.1-26.1% to the Russian Federation), while significantly increasing to the EU by 66.4-49.8%. Moreover, exports to most EU countries increased significantly, and imports to some of them also increased. Export and import growth during the reporting period was also recorded for the United Kingdom, Canada, Korea, and Georgia. Imports continued to grow for the United States, Japan, and Switzerland, while exports to Brazil jumped significantly. Among the CIS countries, exports and imports increased significantly for Ukraine and Turkmenistan, while exports to Uzbekistan jumped significantly. Among the EAEU countries, Kyrgyzstan significantly increased both exports and imports, while Kazakhstan and Belarus significantly increased imports. For China, improved export dynamics, with imports emerging from recession and growing significantly, were accompanied by a slowdown in import growth. The opposite was observed for the United States: imports rose from recession to high double-digit growth, while the decline in exports accelerated.
Russia and China occupy the top two positions in both exports and imports. The UAE, Iraq, and Bulgaria are next in the top five for exports, while Iran, Germany, and the United States are next in the top five for imports.